Abstract
Background: Resilience is essential for healthy ageing in a society where people live longer and face increased individual adversity risks. This study investigated the association between visual impairment and resilience in Brazilians aged 60 and older. We explore personal, sociodemographic, and economic factors that influence the impact of visual impairment on the psychological and social support aspects of resilience outcomes. Resilience was operationally defined at an individual level as an outcome through self-report measures, expressing the preservation of psychological dimensions such as motivation, emotional well-being, and social support in the presence of visual impairment. Method: Data from the Brazilian National Health Survey (2019), a population-based, cross-sectional study using a Partial Proportional Odds Model and a marginal effect at the means to make the results more interpretable. Participants included 21,699 older adults with an average age of 69.5 years; 55% were women; 35% exhibited partial or permanent visual impairment, and 53% were considered resilient. Results: As the severity of visual impairment increases, the likelihood of resilience in older adults decreases for both men and women. Resilience increases with age, regardless of the severity of the disorder. Older men were more resilient than women in all categories of visual impairment. Regardless of the severity of the disorder, unscholarly participants show greater resilience. Participants who rated better health status had better resilience levels. Conclusions: This study suggests that, beyond the positive association with some sociodemographic factors, resilience is strongly related to cultural factors and self-perceived health status among older Brazilians.
Keywords
Visual Impairment, Resilience, Older Population, Brazil, Healthy Ageing
1. Introduction
With the worldwide population ageing rapidly, the proportion of individuals preparing to face physical, sensorial, mental and cognitive challenges is increasing
| [1] | United Nations, Department of Economic and Social Affairs, Population Division. (2015). World population prospects: The 2015 revision, key findings and advance tables. Working Paper No. ESA/P/WP.241. |
[1]
. These challenges also involve everyday developmental, social, and emotional challenges like adjusting to retirement and coping with losing a spouse, family member, or friend
| [2] | Wilson CA, Plouffe RA, & Saklofske DH. (2022). Assessing Resilience in Older Adulthood: Development and Validation of the Resilience Scale for Older Adults. Canadian Journal on Aging / La Revue canadienne du vieillissement 41(2), 214–229. https://doi.org/10.1017/S0714980821000155 |
[2]
. This combination of increased longevity and greater adversity suggests that resilience may be critical in later life
| [2] | Wilson CA, Plouffe RA, & Saklofske DH. (2022). Assessing Resilience in Older Adulthood: Development and Validation of the Resilience Scale for Older Adults. Canadian Journal on Aging / La Revue canadienne du vieillissement 41(2), 214–229. https://doi.org/10.1017/S0714980821000155 |
[2]
.
Vision is crucial in various aspects of life. It helps with social interaction, independence, managing other health conditions, and mental well-being. Vision impairment occurs when an eye condition affects one or more vision functions. Current data based on population surveys does not accurately estimate the global number of people with vision impairment
However, there are a significant global number of people with vision impairment or blindness, estimated at least 2.2 billion. These cases could have been prevented or treated correctly
. Visual impairment and blindness profoundly impact individuals, families, and societies, especially in low and middle-income countries
. Furthermore, older adults with vision impairment confront specific domains of stigma, such as interpersonal relationships and evolving self-perception
| [5] | Kumar, P., Campanile, J., Swenor, B., & Varadaraj, V. (2022). Stigma Among Older Adults With Age-Related Vision Impairments. Journal of Visual Impairment & Blindness, 116, 689 - 698. https://doi.org/10.1177/0145482X221132844 |
[5]
.
As the population ages, the prevalence of vision impairment is expected to increase, with age-related vision loss being a primary cause, and individuals with lower socioeconomic status may be at higher risk
| [6] | Demmin DL, Silverstein SM. Visual Impairment and Mental Health: Unmet Needs and Treatment Options. Clin Ophthalmol. 2020 Dec 3; 14: 4229-4251. https://doi.org10.2147/OPTH.S258783. |
| [7] | Bourne R, Adelson J, Flaxman S, et al. Trends in prevalence of blindness and distance and near vision impairment over 30 years and contribution to the global burden of disease in 2020. Lancet Glob Health 2020. https://doi.org/10.1016/S2214-109X(20)30425-3 |
| [8] | Killeen OJ, De Lott LB, Zhou Y, et al. Population Prevalence of Vision Impairment in US Adults 71 Years and Older: The National Health and Aging Trends Study. JAMA Ophthalmol. 2023; 141(2): 197–204. https://doi.org/10.1001/jamaophthalmol.2022.5840 |
[6-8]
. Some leading causes of vision loss, such as cataracts and refractive errors, can be reversed with treatment
| [9] | Melo VP, Costa MLA, Ribeiro CS, Franken RA, Montanari PM. Envelhecimento no meio urbano: saúde e condições de vida de idosos da zona sul do município de Patos/PB. Fisioter. Bras. 2018; 19(5): S106-S115. https://doi.org/10.33233/fb.v19i5.2611 |
| [10] | Barbosa KTF, Costa KNFM, Pontes MLF, Batista PSS, Oliveira FMRL, Fernandes MGM. Envelhecimento e vulnerabilidade individual: um panorama de idosos atendidos pela estratégia de saúde da família. Texto Contexto Enferm. 2017; 26(2): e2700015 https://doi.org/10.1590/0104-07072017002700015 |
[9, 10]
. However, conventional methods cannot correct age-related macular degeneration
| [3] | World Health Organization (WHO). World report on vision [Internet]. Geneva: World Health Organization; 2019. Available from: Available from: https://www.who.int/publications-detail/world-report-on-vision |
| [9] | Melo VP, Costa MLA, Ribeiro CS, Franken RA, Montanari PM. Envelhecimento no meio urbano: saúde e condições de vida de idosos da zona sul do município de Patos/PB. Fisioter. Bras. 2018; 19(5): S106-S115. https://doi.org/10.33233/fb.v19i5.2611 |
| [10] | Barbosa KTF, Costa KNFM, Pontes MLF, Batista PSS, Oliveira FMRL, Fernandes MGM. Envelhecimento e vulnerabilidade individual: um panorama de idosos atendidos pela estratégia de saúde da família. Texto Contexto Enferm. 2017; 26(2): e2700015 https://doi.org/10.1590/0104-07072017002700015 |
| [11] | Wong WL, Su X, Li X, et al. Global prevalence of age-related macular degeneration and disease burden projection for 2020 and 2040: a systematic review and meta-analysis. Lancet Global Health. 2014; 2(2): e106–e116. https://doi.org10.1016/S2214-109X(13)70145-1 |
| [12] | Pelletier AL, Rojas-Roldan L, Coffin J. Vision Loss in Older Adults. Am Fam Physician. 2016; 94(3): 219–226. PMID: 27479624. |
[3, 9-12]
. However, within the vision-impaired population, there is considerable variation in well-being and physical and mental health
. Whilst some people with vision impairment live fulfilled, independent lives despite significant impairment-resilient-, others have a poor quality of life, even with lesser degrees of impairment
.
Vision impairment in older adults often occurs gradually, restricting their daily activities and negatively impacting functioning, safety, well-being, quality of life and social participation
. It also leads to psychological, social, and economic impacts, causing a loss of self-esteem, occupational restrictions, autonomy, and dependence on others
| [14] | Cordeiro TDC, Silva LM, Monteiro EA, Pontes MLF, Casemiro FG, Rodrigues RAP. Physiological changes in vision during aging: perceptions of older adults and healthcare providers. Invest. Educ. Enferm. 2021; 39(3): e11. https://doi.org10.17533/udea.iee.v39n3e11 |
| [15] | Guthrie DM, Davidson JGS, Williams N, Campos J, Hunter K, Mick P, et al. Combined impairments in vision, hearing and cognition are associated with greater levels of functional and communication difficulties than cognitive impairment alone: Analysis of interRAI data for home care and long-term care recipients in Ontario. Plos One. 2018; 13(2): e0192971. https://doi.org10.1371/journal.pone.0192971 |
[14, 15]
.
In Brazil, data from the Brazilian Council of Ophthalmology (2019) suggests that visual impairments and blindness in adults and older persons are associated with population ageing and economic conditions
. Studies have shown a high prevalence of visual impairment in older adults caused by cataracts, refractive errors, glaucoma and diabetic retinopathy in the Brazilian population
| [16] | Alves Ottaiano JÁ, Pereira de Ávila M, Caixeta Umbelino C, Chater Taleb A. As Condições de Saúde Ocular no Brasil 2019 Edição 1 – 2019. Conselho Brasileiro de Oftalmologia. https://www.cbo.com.br/novo/publicacoes/condicoes_saude_ocular_brasil2019.pdf |
| [17] | Romani FA. Prevalência de transtornos oculares na população de idosos residentes na cidade de Veranópolis, RS, Brasil. Arq Bras Oftalmol. 2005; 68(5): 649-55. https://doi.org/10.1590/S0004-27492005000500015 |
| [18] | Alves, M. R., Nishi, M., Carvalho, K. M. de, Ventura, L. M. V. de O., Schellini, S. A., & José, N. K. (2014). Refração ocular: uma necessidade social. Rio de Janeiro: Cultura Médica. AMB/CFM/FENAM. Disponível em: http://www.gediib.org.br/br/Documentos/pub/KIT-_final%20IMPRENSA.pdf |
[16-18]
.
On the other hand, resilience in later life has been extensively studied and is well-established in research, policy, and practice
| [19] | Artuch-Garde R, González-Torres MdC, de la Fuente J, Vera MM, Fernández-Cabezas M and López-García M (2017) Relationship between Resilience and Self-regulation: A Study of Spanish Youth at Risk of Social Exclusion. Front. Psychol. 8: 612. https://doi.org10.3389/fpsyg.2017.00612 |
| [20] | Windle G. Resilience in Later Life: Responding to Criticisms and Applying New Knowledge to the Experience of Dementia. Springer Nature Switzerland AG 2020 31 A. V. Wister, T. D. Cosco (eds.), Resilience and Aging, Risk, Systems and Decisions, https://doi.org/10.1007/978-3-030-57089-7_3 |
[19, 20]
. The American Psychological Association (2020) defined it as a dynamic adaptive process that can be developed and changes with time and circumstances
. Resilience helps us understand why some people fare better than others facing adversity
. It results from an interaction process involving individual characteristics, social and environmental factors, and stressful circumstances that lead to successful adaptation
. Two important questions when studying resilience are how well people recover from adversity and the sustainability of their ability to keep going
| [23] | Zautra, A. J., Hall, J. S., Murray, K. E., & Resilience Solutions Groups (2008). Resilience: A new integrative approach to health and mental health research. Health Psychology Review, 2, 61– 64. https://doi.org10.1080/17437190802298568 |
[23]
.
Resilience is an essential aspect of successful ageing and can be seen as a way for older individuals to adapt and bounce back in the face of challenges
. It can act as a protective factor during difficult experiences and is influenced by one's outlook and response to circumstances
. Resilience involves positive attitudes and using resources gained from past adversities
. It is a complex process with various components, such as exposure to adversity, positive adaptation, individual differences in response, protective factors, dynamic changes over time, and a multidimensional nature
| [25] | Infurna, F. J. Utilizing principles of life-span developmental psychology to study the complexities of resilience across the adult life span. Gerontologist 2021, 61, 807–818. https://doi.org10.1093/geront/gnab086 |
[25]
.
The relationship between the severity of visual impairment and its impact on psychological well-being is complex. Amongst older people with visual impairment, there are often considerable physical and mental co-morbidities, which compounds the challenges they face. On the other hand, there is also considerable variation in psychological response to adversity imposed by visual impairment
.
In this article, resilience refers to the ability to maintain psychological well-being when facing visual impairment. Resilience was operationally defined at an individual level as an outcome through self-report measures, expressing the preservation of psychological dimensions such as motivation, emotional well-being, and social support in the presence of visual impairment.
In this study, we aim to investigate the relationship between visual impairment and resilience in older adults in Brazil to better understand how certain individual, sociodemographic and economic factors influence the impact of visual impairment on psychological and social support dimensions of outcome resilience.
2. Method
2.1. Study Population
This observational cross-sectional study is based on the last Brazilian National Health Survey (2019) (2019-NHS) conducted by the Brazilian Institute of Geography and Statistics (IBGE) in partnership with the Ministry of Health. The 2019-NHS project was approved by the National Research Ethics Committee from the National Health Council in August 2019
.
The 2019-NHS is a household-based survey representative of the Brazilian noninstitutionalized population at the national, regional, state, and primary metropolitan area levels. The selected sample originated from an IBGE master sample, stratified into three cluster stages: census tracts selected with proportional probability, households selected by simple random and individuals aged 15 or over randomly selected within each household. The interviews were carried out between August 2019 and March 2020 by trained teams using smartphone devices programmed with the survey questionnaire and the processes of criticizing the variables. A total of 90,846 households and 275,323 individuals were interviewed. The response rate for households was 93.6%
.
The original data includes 21,699 surveys corresponding to people aged 60 or older (OP60+) considered competent to respond, with interviews effectively carried out and who answered the module about healthcare utilization by themselves. Registers with income missing data were excluded.
2.2. Measures
2.2.1. Outcome Variable
We must operationalize a resilience definition because survey data does not contain systematized resilience measures for older persons. The criteria to capture resilience were focused on psychological factors and social support availability. Two motivation dimensions were included: self-reported lack of energy and lack of interest or dissatisfaction in performing daily tasks in the last two weeks. The emotional factors, including three dimensions, were assessed through self-reported feelings of depression, worthlessness, and thoughts of self-harm or suicide in the last two weeks. Response options for motivation and emotional situation were: not at all, less than half of the days, more than half of the days, and almost every day. The social support dimension was measured by the self-reported number of family members or friends that can be counted on during good or bad times. Response options were none, one, two, three or more for social support questions.
The resilience variable included three categories and was built according to the following criteria: “no-resilient” indicates that an individual presented adverse motivational or emotional outcomes without support from family or friends on more than half of the days during the last two weeks. On the other hand, a “resilient” category means that the individual never faced any problems in motivation or emotional dimensions and had support from family or friends every day. Those within an intermediate resilience situation who had issues in motivation or emotional dimensions for less than half the days and had family members or friends to rely on during difficult times were considered “moderate resilient”. The “no-resilient” category was considered the reference group for the current analyses.
2.2.2. Interest Variable
The interest variable was self-reported visual impairment, obtained through the questions: Do you have permanent difficulty seeing even when using glasses, contact lenses or magnifying glasses? Or Do you have permanent difficulty seeing? The response options were: no difficulty, yes, some difficulty, yes, much difficulty, yes, not at all. For the current analyses, visual impairment was aggregated into three categories: permanent difficulty (much difficulty or not at all), some difficulty and no difficulty seeing (reference group).
2.2.3. Covariates
From the data collected in the questionnaires of the 2019-NHS, various factors were considered, such as age, sex, ethnicity, marital status, household role, urban residence, education level, income, health insurance, self-rated health (SRH), chronic diseases (non-communicable diseases [NCDs]), basic and instrumental activities of daily living (BADLs and IADLs), sedentary behaviour (more than 6 hours sitting watching television or sitting time using computer at home), sleep disturbances in the last two weeks, social participation (including sports, cultural, recreational, artistic, social/community movements academic, or religious activities in the last year), alternative medicine, and use of hypnotics. These factors were chosen based on their theoretical or empirical association with the outcome variable. Despite physical activity having a recognized positive effect on physical and mental health, in our data, nearly 70% of participants do not register in this variable. Then, to maintain the robustness of the model, it was not included in the analysis.
The sex (1=woman), household role (1=head), urban residents (1=urban), having health insurance (1=yes), sedentary behaviour (1=yes), social participation (1=participation more than twice time a month), use of alternative medicine (1=yes) and use of hypnotics (1=yes) were included as dichotomous variables.
Age, marital status, ethnicity, education level, SRH, chronic diseases, BADLs, IADLs and sleep disturbances were included as categorical variables. Age was categorized into 60-69, 70-79 and 80 or more years (oldest-old). Persons aged 60-69 were the reference group. Marital status was arranged into three categories: married (reference group), single or divorced and widowed. The 2019-NHS ethnicity options were white (reference group), black, yellow, brown-skinned and indigenous. The education status was aggregated into four levels: no unscholarly (reference group), elementary, high, and graduate school. The SRH was categorized into three groups: very good/good, fair and bad/very bad (reference group). The number of chronic diseases was arranged into three categories: none (reference group), 1-2 and 3 or more. The number of BADLs was categorized into three groups: none (reference group), 1-2 and 3 or more. The number of IADLs was categorized into three groups: none (reference group), 1-2 and 3 or more. The sleep disturbances were aggregated into three groups: none (reference group), moderate (around half the days) and severe (almost every day).
The income deciles and number of household persons were included as discrete variables. Furthermore, and how we want to make inferences about the population, the sample weight, corresponding to the weight of selected residents with correction for non-interview with calibration by population projection, was included in the final regression model.
2.3. Statistical Analyses
The relationship between visual impairment and the resilience level adjusted by confounder factors in older persons was analysed. Descriptive statistics were performed to provide a profile of the sample's general characteristics.
Understanding resilience as a dynamic and subjective process, it is worth considering a certain gradualness in its expression. Then, as the dependent variable is measured on an ordinal scale, we use ordinal regression models, also known as the proportional odds models. These models are based on the critical assumption of proportional odds, which means that the impact of explanatory variables remains consistent across the various thresholds or cut-offs of the ordinal outcome variable. Regardless of the threshold, the explanatory variables have the same effect on the odds of the outcome variable
| [27] | Strand Steve, Cadwallader Stuart & Firth David. Module 5 - Ordinal Regression: Key Assumptions of Ordinal Regression. ReStore. National Centre for Research Methods (NCRM). University of Southampton. 2013. https://www.restore.ac.uk/srme/aboutpage.php |
[27]
.
Model Specification
Before the regression analysis, the multicollinearity of the variables was examined using correlation matrices and the variance inflation factor (VIF). VIF values exceeding ten are considered indicators of multicollinearity, but in weaker models, as is usually the case in logistic regression models, values greater than 2.5 may be of concern
| [28] | Allison, P. D. Logistic Regression Using the SAS System: Theory and Application, Cary, NC: SAS Institute Inc. Second Edition. 2012. |
[28]
. The multicollinearity diagnostic statistics were examined using linear regression analysis with household income as the dependent variable. For sample size affecting modelling, the yellow and indigenous ethnic groups were excluded. Then, the current analysis was conducted with 21,349 observations.
Firstly, a standard ordered logistic regression model was fitted, and tests were performed to check the assumption of parallel lines. As the assumption was violated, a Partial Proportional Odds Model (PPOM) using a constrained generalized ordered logit model was estimated. Tests were conducted to assess the assumption of parallel lines for the final model
| [29] | Richard Williams (2008). "Ordinal regression models: Problems, solutions, and problems with the solutions," German Stata Users' Group Meetings 2008 03, Stata Users Group. |
| [30] | Richard Williams. Using the margins command to estimate and interpret adjusted predictions and marginal effects. The Stata Journal (2012) 12, Number 2, pp. 308–331. https://doi.org/10.1177/1536867X1201200209 |
[29, 30]
. To make the results more interpretable, marginal effects at the means (MEMs) were calculated to determine average adjusted probabilities (AAPs)
| [30] | Richard Williams. Using the margins command to estimate and interpret adjusted predictions and marginal effects. The Stata Journal (2012) 12, Number 2, pp. 308–331. https://doi.org/10.1177/1536867X1201200209 |
[30]
. The
mtable command was used to calculate AAPs for variables of interest stratified by sex
| [31] | J. Scott Long and Jeremy Freese. 2014. Regression Models for Categorical Dependent Variables Using Stata, Third Edition. College Station, TX: Stata Press. ISBN-13: 978-1-59718-111-2. |
| [32] | Richard Williams. Adjusted Predictions & Marginal Effects for Multiple Outcome Models & Commands (including ologit, mlogit, oglm, & gologit2). University of Notre Dame. https://www3.nd.edu/~rwilliam/ Last revised January 25, 2021. |
[31, 32]
. Additionally, AAPs were calculated for representative cases of socioeconomic, gender and health conditions in Brazil.
The statistical analysis was performed using Stata version 14.0. The statistical significance was tested using Wald's chi-square statistic, and a level of significance of 5% was accepted. Brazilian monetary values were expressed in nominal 2019 reais (R$2019).
3. Results
3.1. Descriptive
A total of 21,699 OP60+ with an average age of 69.5 years (Std.: 7.43); 54.9% female, most of them living in Northeast (33.7%), Southeast (25.6%) and North (15.5%) regions were studied. Forty-four per cent were self-referred as brown-skinned, 43% as white, 11% as black and 2% as other ethnicities. Forty-four per cent were married, 30% were single or divorced and 26% were widowed; 76% lived in urban areas, 72% were unscholarly or elementary school, and only 12% graduated. Individuals in the 1st and 10th deciles had an average monthly household income of R$343 and R$17,249, respectively.
64.6% of the surveyed reported “none”, 26.2% “some” and 9.2% “permanent” visual impairment. Women are more affected (54%) by visual impairment. On the other hand, in the sample, 53% of the OP60+ showed a resilient status, 27% had moderate resilience status, and 20% were no-resilient. Furthermore, among OP60+ with permanent visual impairment, the proportion found to be resilient was 35% and 38% no-resilient.
Table 1 presents the geographic and socio-demographic characteristics of the studied population according to resilience categories.
Table 1. Socio-demographics characteristics of the sample according to Resilience categories. OP60+. NHS-2019.
Characteristics | Resilience Categories |
no-resilient (n: 4,359) | Moderate (n: 5,883) | resilient (n: 11,457) |
age groups (years) (n.s.) | | | |
60-69 | 56% | 57% | 57% |
70-79 | 32% | 31% | 32% |
80+ | 11% | 12% | 11% |
sex (% women) ** | 67% | 62% | 46% |
ethnicity ** | | | |
white (ref.) | 43% | 41% | 45% |
black | 11% | 11% | 11% |
yellow | 1% | 1% | 1% |
brown-skinned | 44% | 46% | 43% |
indigenous | 1% | 1% | 1% |
marital status ** | | | |
married (ref.) | 40% | 41% | 48% |
single/divorced | 31% | 30% | 29% |
widowed | 29% | 29% | 23% |
head of household (n.s.) | 82% | 83% | 84% |
number of persons at household (mean, SD) | 2.2 (1.25) | 2.2 (1.22) | 2.2 (1.17) |
urban residence (%) ** | 80% | 77% | 74% |
education level ** | |
Unscholarly (ref.) | 20% | 20% | 20% |
Elementary school | 55% | 52% | 50% |
High School | 16% | 16% | 16% |
Graduated School | 9% | 12% | 14% |
household income decils, monthly avg, R$ (%)** |
1st decile | 305 (5%) | 278 (3%) | 308 (3%) |
2nd decile | 1,004 (20%) | 1,008 (17%) | 1,007 (16%) |
3rd decile | 1,382 (8%) | 1,382 (8%) | 1,397 (7%) |
4th decile | 1,950 (17%) | 1,955 (17%) | 1,953 (16%) |
5th decile | 2,212 (11%) | 2,213 (11%) | 2,220 (10%) |
6th decile | 2,845 (9%) | 2,835 (10%) | 2,827 (10%) |
7th decile | 3,489 (8%) | 3,504 (9%) | 3,510 (9%) |
8th decile | 4,544 (8%) | 4,536 (8%) | 4,551 (9%) |
9th decile | 6,579 (7%) | 6,586 (9%) | 6,606 (9%) |
10th decile | 14,958 (7%) | 16,464 (9%) | 17,911 (11%) |
health insurance (%) ** | 23% | 25% | 27% |
visual impairment (%) ** | |
none (ref.) | 51% | 61% | 72% |
moderate | 31% | 30% | 22% |
permanent | 18% | 9% | 6% |
number chronic diseases ** | |
none (ref.) | 9% | 13% | 27% |
1-2 | 38% | 49% | 54% |
3+ | 53% | 38% | 20% |
number BADLs ** | | |
none (ref.) | 65% | 80% | 89% |
1-2 | 15% | 11% | 6% |
3+ | 20% | 10% | 5% |
number IADLs ** | | |
none (ref.) | 45% | 54% | 61% |
1-2 | 26% | 28% | 30% |
3+ | 29% | 17% | 9% |
sleep disturbances ** | | | |
none (ref.) | 27% | 45% | 78% |
moderate | 37% | 40% | 14% |
severe | 36% | 15% | 7% |
self-rated health status ** | | | |
bad/very bad (ref.) | 28% | 11% | 5% |
fair | 50% | 49% | 37% |
good/very good | 22% | 40% | 58% |
sedentary behaviour ** | 14% | 9% | 8% |
social participation ** | 55% | 62% | 59% |
use of alternative medicines ** | 9% | 9% | 6% |
use of hipnotics ** | 28% | 15% | 7% |
ref: reference group.; *: pvalue < 0,05; **: p-value < 0,001; n.s.: no significant
Overall, the participants found “no resilient” were primarily women, mostly self-referred as brown-skinned or white, with lower educational level, a quarter of them located in the lowest two household income deciles, a fifth of them living in rural areas, relatively low social participation, with higher prevalence’s; of chronic diseases, BADLs, IADLs, sleep disturbances, sedentary behaviour and use of the hypnotics. Furthermore, most of them perceived their health status as fair or bad/very bad. Concerning visual impairment, 49% of the OP60+ in this resilience category have moderate or permanent difficulty seeing.
The “resilient” participants were primarily men, mostly self-referred to as white or brown-skinned, almost a tier with a high school and graduated educational level, a fifth of them located in the highest two household income deciles, a quarter of them living in rural areas, relatively high social participation, with relative lower prevalences; of chronic diseases, BADLs, IADLs, sleep disturbances, sedentary behaviour and use of hypnotics. Furthermore, most of them perceived their health as good/very good. Concerning visual impairment, 28% of the OP60+ in this resilience category have moderate or permanent difficulty seeing.
3.2. Model Goodness-of-fit Statistics
The correlation between the resilience and the visual impairment variables was weak (r < 0.19). Also, a weak correlation between the visual impairment variable and covariates (r < 0.30) was observed. The average VIF for all variables in the model was 1.33, and the interest variable was lower than 1.20, indicating the non-existence of multicollinearity.
After fitting the standard ordered logit model, the Brant and Likelihood-Ratio tests on the parallel lines assumption reveal that it has been violated. By fitting the partial proportional odds model, the global Wald test shows sixteen constraints have been imposed in the final model, corresponding to twelve variables (education level, age groups, head of household, urban residence, marital status, ethnicity, health insurance, BADLs, IADLs, alternative medicines, number of persons at household and sample weight) being constrained to have their effects meet the parallel-lines assumption. For the constrained partial proportional odds final model, statistically insignificant Wald test (Prob chi2=0.292) and Likelihood-ratio test ((assumption gologit2 nested in logit), Prob chi2=0.302) of parallel lines assumption for the model indicates that this model does not violate the parallel-lines assumption.
3.3. Coefficients and Odds Ratios
Table 2 shows the PPOM results for two versions of the estimates, i.e., in coefficients and the odds ratio estimates. There are two result panels in
Table 2, i.e., the “resilient” and “moderate resilience” categories. The first panel contrasts the “resilient” category with the “moderate” and “no-resilient” categories. The signs of the coefficients in the first panel imply how likely an OP60+ to express a resilience attitude as opposed to the remaining two categories. Similarly, the second panel contrasts the “resilient” and the “moderate” categories with the no-resilient category.
Altogether, the model estimates 64 coefficients; however, the coefficients and odds ratios of the variables constrained for the parallel lines assumption are identical in both panels. In turn, the variables with different coefficients in both panels were found to violate the parallel lines assumption in the standard ordered logistic regression model.
In interpreting the results of each panel in
Table 2, positive coefficients or odds ratios greater than one indicate that higher values on the explanatory variable make it more likely that the individual will be in a higher resilience category than the current one. In contrast, negative coefficients or odds ratios lower than one indicate that higher values on the explanatory variable increase the likelihood of being in the current or a lower resilience category
.
Table 2. Coefficients and Odds Ratios of the constrained PPOM. OP60+. NHS-2019.
| coefficient | s.e. | odds ratio | s.e. |
high resilience | | | | |
visual impairment | | | | |
moderate ** | 0.2727 | 0.03759 | 1.313 | 0.04937 |
permanent ** | 0.3883 | 0.05998 | 1.474 | 0.08842 |
age groups | | | | |
70-79 ** | -0.1338 | 0.03304 | 0.875 | 0.02895 |
80+ ** | -0.2990 | 0.05142 | 0.742 | 0.03813 |
women ** | 0.3882 | 0.03541 | 1.474 | 0.05219 |
marital status | | | | |
single/divorced * | 0.0999 | 0.03695 | 1.105 | 0.04083 |
widowed (n.s.) | 0.0439 | 0.04400 | 1.045 | 0.04597 |
ethnicity | | | |
black (n.s.) | -0.0513 | 0.04970 | 0.950 | 0.04722 |
brown-skinned (n.s.) | 0.0093 | .034810 | 1.009 | 0.03513 |
head of household (n.s.) | -0.0324 | 0.04224 | 0.968 | 0.04089 |
urban residence ** | 0.2585 | 0.03732 | 1.295 | 0.04833 |
education level | | | |
elementary school ** | 0.1736 | 0.03982 | 1.189 | 0.04737 |
high school ** | 0.2707 | 0.05487 | 1.311 | 0.07192 |
graduated school * | 0.1789 | 0.06738 | 1.196 | 0.08058 |
deciles (n.s.) | -0.0129 | 0.00781 | 0.987 | 0.00771 |
health insurance (n.s.) | -0.0276 | 0.04099 | 0.973 | 0.03988 |
self-rated health status | | |
fair ** | -0.5438 | 0.05897 | 0.581 | 0.03423 |
good/very good ** | -1.0208 | 0.06267 | 0.360 | 0.02258 |
chronic diseases | | | |
1-2 ** | 0.3677 | 0.04481 | 1.444 | 0.06472 |
3+ ** | 0.8954 | 0.05087 | 2.448 | 0.12454 |
BADLs | | | | |
1-2 ** | 0.3468 | 0.05037 | 1.415 | 0.07125 |
3+ ** | 0.4279 | 0.05602 | 1.534 | 0.08594 |
IADLs | | | | |
1-2 ** | 0.2059 | 0.03787 | 1.229 | 0.04653 |
3+ ** | 0.3867 | 0.05526 | 1.472 | 0.08134 |
sedentary behaviour (n.s.) | 0.0935 | 0.05366 | 1.098 | 0.05891 |
sleep disturbances | | |
moderate ** | 1.4725 | 0.03912 | 4.360 | 0.17057 |
severe ** | 1.5562 | 0.05546 | 4.741 | 0.26291 |
social participation (n.s.) | 0.0255 | 0.03339 | 1.026 | 0.03426 |
alternative medicines * | 0.1855 | 0.05409 | 1.204 | 0.06511 |
use of hipnotics * | -0.1119 | 0.05689 | 0.894 | 0.05087 |
number of persons at household * | 0.0314 | 0.01434 | 1.032 | 0.01480 |
moderate resilience | | | | |
visual impairment | | | | |
moderate ** | 0.1723 | 0.04454 | 1.188 | 0.05291 |
permanent ** | 0.5144 | 0.06195 | 1.673 | 0.10362 |
women ** | 0.2877 | 0.04372 | 1.333 | 0.05880 |
marital status | | | | |
widowed (n.s.) | -0.0499 | 0.05023 | 0.951 | 0.04778 |
ethnicity | | | |
brown-skinned * | -0.1324 | 0.04134 | 0.876 | 0.03622 |
deciles * | -0.0299 | 0.00895 | 0.970 | 0.00869 |
self-rated health status | | |
fair ** | -0.7602 | 0.05438 | 0.468 | 0.02543 |
good/very good ** | -1.3941 | 0.06414 | 0.248 | 0.01591 |
chronic diseases | | | |
1-2 * | 0.1765 | 0.06396 | 1.193 | 0.07630 |
3+ ** | 0.6017 | 0.06677 | 1.825 | 0.12188 |
IADLs | | | | |
1-2 * | 0.1070 | 0.04704 | 1.113 | 0.05236 |
3+ ** | 0.2758 | 0.05850 | 1.318 | 0.07708 |
sedentary behaviour ** | 0.2650 | 0.05941 | 1.303 | 0.07744 |
sleep disturbances | | |
moderate ** | 0.9465 | 0.04714 | 2.577 | 0.12147 |
severe ** | 1.6767 | 0.05572 | 5.348 | 0.29800 |
social participation ** | -0.1770 | 0.04017 | 0.838 | 0.03366 |
use of hipnotics * | 0.1269 | 0.05296 | 1.135 | 0.06013 |
s.e. = standard errors. Statistical significances: * p <0.05, ** p <0.001, (n.s.): no significant.
Then, the positive coefficient of 0.1736 for the variable ‘elementary school’ in the first panel indicates that an individual with this education level would be more likely to express a resilience level than a “moderate” or “no-resilient” level. On the other hand, the negative coefficient of 0.1770 for the variable ‘social participation’ in the second panel indicates that an individual with any social activity during the last year would be more likely to express a “moderate” or “no-resilient” level than a resilience” level.
3.4. Marginal Effects
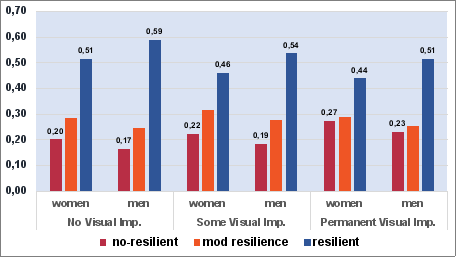
The following graphs present the marginal effects of visual impairment in terms of average adjusted probabilities (AAPs) on resilience categories for some relevant socio-demographic factors. Overall, those OP60+ without visual impairment showed a 55% probability of being resilient. As the severity of visual impairment increased, the probability of resilience decreased from 50% to 47%, from some visual impairment to a permanent status.
According to the model, on an all-other-things-being-equal basis,
Figure 1 shows that increased visual impairment is associated with higher probabilities of a worse resilience outcome in both sexes. Even when OP60+ do not present visual difficulties, women are less likely to have better levels of resilience than men.
Figure 1. AAPs for Resilience levels and Visual Impairment by sex. OP60+. NHS-2019.
Older women have a 44% probability of expressing resilience when facing a permanent visual impairment and a 27% probability of being no-resilient. Meanwhile, older men in the same visual condition displayed a 51% and 23% probability of being resilient and no-resilient, respectively. The differences were statistically significant.
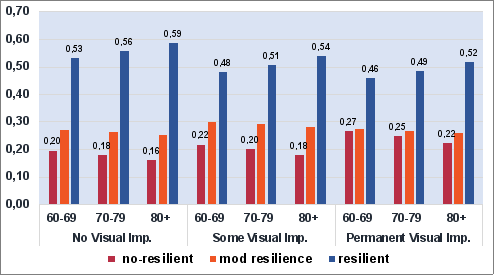
Figure 2 shows that increased visual impairment is associated with higher probabilities of a worse resilience outcome as age increases. Nevertheless, regardless of the severity of the visual impairment, better resilience outcomes are observed as age increases. Oldest-old persons with permanent visual impairment have a higher probability of being resilient (52%) and a lower probability (22%) of being no-resilient in comparison with other young adult groups. These differences were statistically significant.
Figure 2. AAPS for Resilience levels and Visual Impairment by age groups. OP60+. NHS-2019.
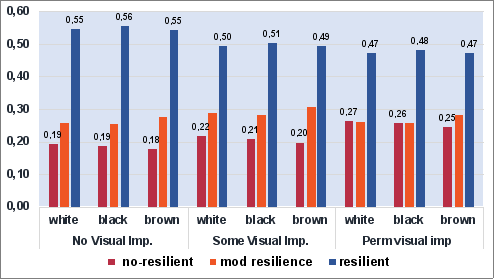
Figure 3 shows that increased visual impairment is associated with slightly higher probabilities of a worse resilience outcome as ethnicity moves from white to brown-skinned. However, a white OP60+ with permanent visual impairment have a significantly higher probability of being no-resilient than black and brown-skinned ethnics. On the other hand, ethnicity does not make significant differences among resilient participants with permanent visual impairment.
Figure 3. APPs for Resilience levels and Visual Impairment by ethnicity. OP60+. NHS-2019.
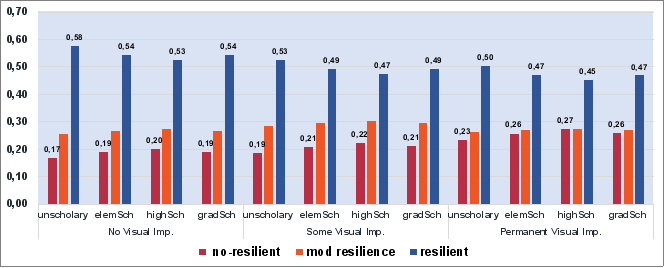
Figure 4 shows that increased visual impairment is associated with higher probabilities of a worse resilience outcome across all education levels. It must be noted that regardless of the visual impairment condition, unscholarly OP60+ expressed a better level of resilience: a higher probability of being resilient and a lower probability of being no-resilient. The OP60+ with high school education had a worse resilience outcome across visual impairment conditions than the other education levels. These differences were statistically significant. On the other hand, OP60+ in elementary school showed the exact resilience probabilities of those who graduated on the three visual impairment conditions.
Figure 4. AAPs for Resilience levels and Visual Impairment by education level. OP60+. NHS-2019.
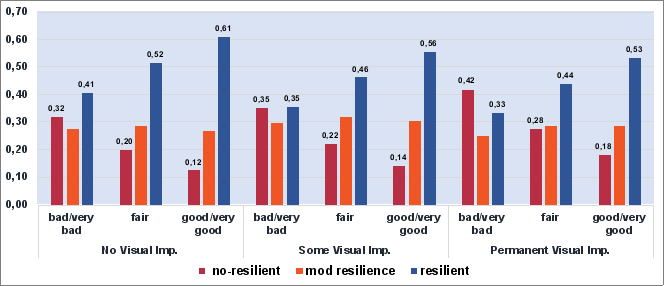
The association of resilience levels and self-rated health (SRH) status was analyzed to assess consistency in resilience assessment. We hypothesized that there would be a direct relationship between resilience and SRH status.
Figure 5 shows that increased visual impairment is associated with higher probabilities of a worse resilience outcome across all SRH categories. It must be noted that regardless of the visual impairment condition, a good/very good self-perceived health of the OP60+ expressed a better resilience outcome. On the contrary, OP60+ with bad/very bad self-perceived health had a worse resilience outcome across visual impairment conditions. These differences were statistically significant. These results support our hypothesis that better SRH status is significantly associated with increased resilience levels, and worse SRH status is significantly associated with decreased resilience.
Figure 5. AAPs for Resilience levels and Visual Impairment by SRH status. OP60+. NHS-2019.
Table 3 shows AAPs for the resilient and no-resilient OP60+ with permanent visual impairment for two representative socioeconomic and health conditions in Brazilian society. A well-off condition includes people who self-declared white ethnicity and belong to the ninth decile. Conversely, the poor condition includes black ethnicity and belonging to the second decile. AAPs were calculated for the pairs: 1) without NCDs, without BADLs limitations and social participation in any social activity more than twice a month, and 2) those with three or more NCDs, three or more BADLs limitations and without social participation. Then, the APPs were distributed by sex and age groups.
Table 3. AAPs for Resilience in Permanent Visual Impairment by Socioeconomics and Chronic health conditions and Social participation. OP60+. NHS-2019.
| Well-off OP60+ (white, 9th decile) | Poor OP60+ (black, 2nd decile) |
without CHC/with SP | with CHC/without SP | without CHC/with SP | with CHC/without SP |
no-resilient | high resilience | no-resilient | high resilience | no-resilient | high resilience | no-resilient | high resilience |
Women (age group) |
60-69 y-old | 0.21 | 0.53 | 0.42 | 0.27 | 0.23 | 0.53 | 0.45 | 0.27 |
70-79 y-old | 0.19 | 0.56 | 0.39 | 0.30 | 0.21 | 0.55 | 0.42 | 0.29 |
80+ y-old | 0.17 | 0.59 | 0.36 | 0.33 | 0.19 | 0.59 | 0.39 | 0.32 |
Men (age group) |
60-69 y-old | 0.17 | 0.61 | 0.36 | 0.35 | 0.19 | 0.60 | 0.39 | 0.34 |
70-79 y-old | 0.15 | 0.64 | 0.33 | 0.37 | 0.17 | 0.63 | 0.36 | 0.37 |
80+ y-old | 0.14 | 0.67 | 0.30 | 0.41 | 0.15 | 0.66 | 0.33 | 0.40 |
CHC: Chronic Health Conditions (NCDs and BADLs). SP: Social participation
Overall, in both socioeconomics groups and regardless of the chronic health conditions and social participation, a better resilience probability as increased age was observed in both sexes. In addition, oldest-old men have better resilience outcomes than women across the socioeconomic, chronic health conditions, social participation and age groups. These differences were statistically significant.
In both the well-of and poor groups, the wealthiest OP60+ with visual impairment, regardless of their chronic health conditions and social participation, were more likely to have slightly better resilience than the poor group across the age groups. These differences were quietly more clear in men than women. A remarkable difference is observed in resilience probability between groups with and without chronic health conditions and social participation across the socioeconomic groups. OP60+ without chronic health conditions and active social participation had just twice the resilience probability as those with chronic health conditions and no social participation.
4. Discussion
The 2015 World Report on Aging and Health states that older persons often face challenges and difficulties as they age and experience frailty, disability, and physical and cognitive decline. These issues worsen with age but are not solely due to ageing and can vary among individuals throughout their life cycle. The report also highlights that despite facing multiple functional and health problems, advanced age does not always result in a decline in quality of life or well-being for older adults
.
Understanding the role of resilience in successful ageing is a significant challenge to guarantee a better quality of life and well-being for older persons. This study examined the resilience association with visual impairment in OP60+ in Brazil. Comprehend how the interaction between these factors on the quality of life and well-being of OP60+ may assist in implementing effective public healthy ageing policies.
Using a derived- unorthodox- measure that considers individual psychological and social factors, this study explores the concept of resilience. Key individual factors include personal motivation - a sense of purpose or meaning in life- and emotional well-being, which are connected to mental and physical health outcomes. The measure also includes social support from family and friends because it is vital for older people to overcome challenges and crises
| [36] | Musich, S., Wang, S. S., Kraemer, S., Hawkins, K., & Wicker, E. (2018). Purpose in life and positive health outcomes among older adults. Population Health Management, 21(2), 139–147. https://doi.org10.1089/pop.2017.0063 |
| [37] | Yang-Tzu Li & Yvonne Su Yong Ow (2022) Development of resilience scale for older adults, Aging & Mental Health, 26: 1, 159-168. https://doi.org/10.1080/13607863.2020.1861212 |
[36, 37]
. Using a partial proportional odds model, adjusted by demographics, economics, chronic health conditions, and social participation, we calculate marginal effects to determine average adjusted probabilities of resilience in individuals with visual impairment.
The discussion will focus mainly on the impact of permanent visual impairment on resilience outcomes in terms of probability among older adults. In this study, high-level resilience is prevalent in 53% of the population aged 60 and above. However, for individuals with visual impairment, the prevalence of high-level resilience was only 35%. The overall result aligns with previous research conducted in the USA, which showed a resilience prevalence of 44% among adults aged 65 or belonging to AARP Medicare Supplement insureds
| [38] | Musich S, Wang SS, Schaeffer JA, Kraemer S, Wicker E, Yeh CS. The association of increasing resilience with positive health outcomes among older adults. Geriatr Nurs. 2022; 44: 97–104. https://doi.org10.1016/j.gerinurse.2022.01.007 |
[38]
. In contrast, a study in Germany during the first COVID-19 lockdown estimated a prevalence of high resilience of 18.7% among adults aged 65 or older
| [39] | Weitzel EC, Löbner M, Röhr S, Pabst A, Reininghaus U, Riedel-Heller SG. Prevalence of High Resilience in Old Age and Association with Perceived Threat of COVID-19-Results from a Representative Survey. Int J Environ Res Public Health. 2021 Jul 5; 18(13): 7173. https://doi.org10.3390/ijerph18137173 |
[39]
.
This study found several key findings: Firstly, as the severity of visual impairment increases, the likelihood of resilience decreases in OP60+ for both sexes. Secondly, older men were more resilient than women across all categories of visual impairment. Thirdly, regardless of impairment severity, resilience improves with age. Fourthly, ethnicity does not have a significant impact on resilience among those with permanent visual impairment. Fifthly, regardless of impairment severity, unscholarly OP60+ show higher resilience than high-schooled adults. Lastly, OP60+ who perceive their health as good/very good have better resilience outcomes, while those who perceive their health as bad/very bad have worse resilience outcomes. Findings related to sex and health status are consistent, with several studies showing consistently a higher likelihood of increased resilience levels in males and those with better health outcomes
| [37] | Yang-Tzu Li & Yvonne Su Yong Ow (2022) Development of resilience scale for older adults, Aging & Mental Health, 26: 1, 159-168. https://doi.org/10.1080/13607863.2020.1861212 |
| [38] | Musich S, Wang SS, Schaeffer JA, Kraemer S, Wicker E, Yeh CS. The association of increasing resilience with positive health outcomes among older adults. Geriatr Nurs. 2022; 44: 97–104. https://doi.org10.1016/j.gerinurse.2022.01.007 |
| [40] | Rodrigues FR, Tavares DMS. Resilience in elderly people: factors associated with sociodemographic and health conditions. Rev Bras Enferm. 2021; 74 (Suppl 2): e20200171. http://dx.doi.org/10.1590/0034-7167-2020-0171 |
| [41] | Hayat, S. Z., Khan, S., & Sadia, R. (2016). Resilience, wisdom, and life satisfaction in elderly living with families and in old-age homes. Pakistan Journal of Psychological Research, 31(2), 475–494. |
| [42] | Jahangir, K., Amir, S., & Parvaneh, K. (2017). The prediction of life satisfaction among the elderly based on resilience and happiness. Journal of Aging Psychology, 2(4), 229–236. |
| [43] | Jeste, D. V., Savla, G. N., Thompson, W. K., Vahia, I. V., Glorioso, D. K., Martin, A. S., … Depp, C. A. (2013). Association between older age and more successful aging: Critical role of resilience and depression. The American Journal of Psychiatry, 170(2), 188–196. https://doi.org10.1176/appi.ajp.2012.12030386 |
| [44] | Smith, J. L., & Hollinger-Smith, L. (2015). Savoring, resilience, and psychological well-being in older adults. Aging & Mental Health, 19(3), 192–200. https://doi.org10.1080/13607863.2014.986647 |
[37, 38, 40-44]
.
Previous studies found heterogeneous results regarding the association between age and resilience among older adults. Surprisingly, in our study, the oldest-old individuals with visual impairment displayed the highest probability of being resilience (52%), contrary to the results of authors that suggest that after the age of 65, the prevalence of high resilience decreases with greater age
| [39] | Weitzel EC, Löbner M, Röhr S, Pabst A, Reininghaus U, Riedel-Heller SG. Prevalence of High Resilience in Old Age and Association with Perceived Threat of COVID-19-Results from a Representative Survey. Int J Environ Res Public Health. 2021 Jul 5; 18(13): 7173. https://doi.org10.3390/ijerph18137173 |
| [45] | Perna L., Mielck A., Lacruz M. E., Emeny R. T., Holle R., Breitfelder A., Ladwig K. H. Socioeconomic position, resilience, and health behaviour among elderly people. Int. J. Public Health. 2012; 57: 341–349. https://doi.org10.1007/s00038-011-0294-0 |
[39, 45]
due to the social loss experiences and challenges to psychological well-being among the oldest-old
| [39] | Weitzel EC, Löbner M, Röhr S, Pabst A, Reininghaus U, Riedel-Heller SG. Prevalence of High Resilience in Old Age and Association with Perceived Threat of COVID-19-Results from a Representative Survey. Int J Environ Res Public Health. 2021 Jul 5; 18(13): 7173. https://doi.org10.3390/ijerph18137173 |
[39]
. A possible explanation for our results is based on Brazil's culture, known for its friendliness, cheerfulness, and light-heartedness, which contribute to the oldest-old resilience. Future studies should consider the association between resilience and cultural factors in old age.
Previous research on education and resilience in old age also has heterogeneous results. Some studies found no association between education and resilience
| [46] | Netuveli G., Wiggins R. D., Montgomery S. M., Hildon Z., Blane D. Mental health and resilience at older ages: Bouncing back after adversity in the British Household Panel Survey. J. Epidemiol. Community Health. 2008; 62: 987–991. https://doi.org10.1136/jech.2007.0691387 |
| [47] | Wells M. Resilience in Older Adults Living in Rural, Suburban, and Urban Areas. OJRNHC. 2010; 10: 45–54. https://doi.org10.14574/ojrnhc.v10i2.55 |
[46, 47]
, while others found higher levels of resilience among individuals with more education
| [39] | Weitzel EC, Löbner M, Röhr S, Pabst A, Reininghaus U, Riedel-Heller SG. Prevalence of High Resilience in Old Age and Association with Perceived Threat of COVID-19-Results from a Representative Survey. Int J Environ Res Public Health. 2021 Jul 5; 18(13): 7173. https://doi.org10.3390/ijerph18137173 |
| [45] | Perna L., Mielck A., Lacruz M. E., Emeny R. T., Holle R., Breitfelder A., Ladwig K. H. Socioeconomic position, resilience, and health behaviour among elderly people. Int. J. Public Health. 2012; 57: 341–349. https://doi.org10.1007/s00038-011-0294-0 |
| [48] | Hardy S. E., Concato J., Gill T. M. Resilience of community-dwelling older persons. J. Am. Geriatr. Soc. 2004; 52: 257–262. https://doi.org10.1111/j.1532-5415.2004.52065.x |
[39, 45, 48]
. In contrast, we found that unschooled older Brazilians with visual impairment are significantly more likely to have higher resilience levels than those with other education levels. This finding contradicts existing literature and may be attributed to resilience being more strongly associated with psychosocial rather than intellectual factors. The unschooled older Brazilians live on the margins of an individualistic and competitive society, away from daily social stressors and high expectations, suggesting that they feel less threatened by the adverse life circumstances, allowing them to focus on family, social, spiritual, religious, and leisure activities throughout their lifetime.
Brazil is experiencing a major demographic and epidemiological transition. This phenomenon also occurs in significant socioeconomic and territorial inequalities affecting people across all age groups but is more prevalent among older and socially disadvantaged populations
| [49] | Lima-Costa, M. F., Andrade, F. B., Souza Jr, P. R., Neri, A. L., Duarte, Y. A., Castro-Costa, E., & Oliveira, C. (2018). The Brazilian longitudinal study of aging (ELSI-Brazil): objectives and design. American Journal of Epidemiology, 187(7). https://doi.org10.1093/aje/kwx387 |
| [50] | United Nations Development Programme. (2022). Human Development Report 2021/2022: Uncertain times, unsettled lives shaping our future in a transforming world. https://hdr.undp.org/informe-sobre-desarrollo-humano-2021-22 |
| [51] | OECD (2021), OECD Reviews of Health Systems: Brazil 2021, OECD Reviews of Health Systems, OECD Publishing, Paris, https://doi.org/10.1787/146d0dea-en |
| [52] | Veras, R. P., & Oliveira, M. (2018). Envelhecer no Brasil: a construção de um modelo de cuidado. Ciência & Saúde Coletiva, 23(6), 1929–1936. https://doi.org/10.1590/1413-81232018236.04722018 |
[49-52]
. In this context, examining two representative socioeconomic scenarios, we confirm that oldest-old men have significantly better resilience than women across the socioeconomic, chronic health conditions, social participation and age groups. Chronic diseases, disability, and social participation in OP60+ with permanent visual impairment significantly influence resilience. Additionally, the wealthiest OP60+ with permanent visual impairment tend to have slightly better resilience levels than the poorest, irrespective of their health and social conditions. It is important to note that chronic health conditions and social participation strongly affect resilience levels in older persons more than their income and social class.
The strengths of this study are as follows: (1) it includes a representative sample of the older adults Brazilian population; (2) identifying and including relevant confounding variables in the statistical analysis allows to build a robust and parsimonious model; (3) using ordinal logistic regression which allows going beyond a binary analysis that can over or underestimate visual impairment effect on resilience gaining meaningful information, and increase the statistical power of the model and (4) using estimates average adjusted probabilities (AAPs) on resilience categories simplifies the interpretation of the results.
The study also had some limitations. No causal inference can be drawn when interpreting these results since the study relies on cross-sectional data. Second, visual impairment and resilience variables were assessed based on self-reports. Third, the resilience variable was not collected based on a validated conventional scale. Finally, the model may be over-adjusted since some socio-demographic factors significantly affect resilience and visual impairment.
Future research should focus on two relevant aspects: the validation of specific instruments for measuring resilience in older people and the development of prospective and longitudinal studies that examine the relationship between resilience and personality traits, physical activity, mental health and social participation in older adults. Understanding these relationships would be necessary in identifying vulnerable older people and proposing practical strategies or interventions to promote resilient behaviours for the older population, particularly those with disability and/or mental or psychosocial impairments.
5. Conclusion
Resilience is essential for successful and healthy ageing in a society where people live longer and face increased individual adversity risks. Beyond a positive association with some socio-demographic factors, this study suggests that resilience is strongly linked to cultural factors and the self-perceived health of the older Brazilian population. The education level and socioeconomic conditions had less of an impact. Further research is needed using specific resilience measures and scales for older persons to understand the relationship between resilience, chronic diseases, functional health, education, and socioeconomic disparities. Developing and implementing intervention programs that help older persons build resilience and adapt to their challenges in later life is also recommended.
Abbreviations
NHS-2019 | National Health Survey (2019) |
IBGE | The Brazilian Institute of Geography and Statistics |
OP60+ | People Aged 60 or Older |
SRH | Self-rated Health |
NCDs | Non-communicable Diseases |
BADLs | Basic Activities of Daily Living |
IADLs | Instrumental Activities of Daily Living |
VIF | The Variance Inflation Factor |
PPOM | The Partial Proportional Odds Model |
MEMs | The Marginal Effects at the Means |
AAPs | Average Adjusted Probabilities |
R$ | Reais (Brazilian currency) |
AARP® | Medicare Supplement Insurance Plan from United Healthcare (USA) |
Acknowledgments
The authors utilized AI-Grammarly to enhance grammar and language in the manuscript.
Author Contributions
Pedro Olivares-Tirado: Conceptualization, Formal Analysis, Investigation, Methodology, Writing – original draft, Writing – review & editing.
Rosendo Zanga: Resources, Formal Analysis, Investigation, Visualization, Project administration, Writing – review & editing.
Funding
This work is not supported by any external funding.
Data Availability Statement
The data supporting this study's findings can be found at https://www.ibge.gov.br/estatisticas/downloadsestatisticas.htmlcaminho=PNS/2019/ Microdados/Dados.
Conflicts of Interest
The authors declare no conflicts of interest.
References
| [1] |
United Nations, Department of Economic and Social Affairs, Population Division. (2015). World population prospects: The 2015 revision, key findings and advance tables. Working Paper No. ESA/P/WP.241.
|
| [2] |
Wilson CA, Plouffe RA, & Saklofske DH. (2022). Assessing Resilience in Older Adulthood: Development and Validation of the Resilience Scale for Older Adults. Canadian Journal on Aging / La Revue canadienne du vieillissement 41(2), 214–229.
https://doi.org/10.1017/S0714980821000155
|
| [3] |
World Health Organization (WHO). World report on vision [Internet]. Geneva: World Health Organization; 2019. Available from: Available from:
https://www.who.int/publications-detail/world-report-on-vision
|
| [4] |
Burton MJ, Ramke J, Marques AP, et al. The lancet global health commission on global eye health: vision beyond 2020. Lancet Glob Health 2021.
https://doi.org10.1016/S2214-109X(20)30488-5
|
| [5] |
Kumar, P., Campanile, J., Swenor, B., & Varadaraj, V. (2022). Stigma Among Older Adults With Age-Related Vision Impairments. Journal of Visual Impairment & Blindness, 116, 689 - 698.
https://doi.org/10.1177/0145482X221132844
|
| [6] |
Demmin DL, Silverstein SM. Visual Impairment and Mental Health: Unmet Needs and Treatment Options. Clin Ophthalmol. 2020 Dec 3; 14: 4229-4251.
https://doi.org10.2147/OPTH.S258783.
|
| [7] |
Bourne R, Adelson J, Flaxman S, et al. Trends in prevalence of blindness and distance and near vision impairment over 30 years and contribution to the global burden of disease in 2020. Lancet Glob Health 2020.
https://doi.org/10.1016/S2214-109X(20)30425-3
|
| [8] |
Killeen OJ, De Lott LB, Zhou Y, et al. Population Prevalence of Vision Impairment in US Adults 71 Years and Older: The National Health and Aging Trends Study. JAMA Ophthalmol. 2023; 141(2): 197–204.
https://doi.org/10.1001/jamaophthalmol.2022.5840
|
| [9] |
Melo VP, Costa MLA, Ribeiro CS, Franken RA, Montanari PM. Envelhecimento no meio urbano: saúde e condições de vida de idosos da zona sul do município de Patos/PB. Fisioter. Bras. 2018; 19(5): S106-S115.
https://doi.org/10.33233/fb.v19i5.2611
|
| [10] |
Barbosa KTF, Costa KNFM, Pontes MLF, Batista PSS, Oliveira FMRL, Fernandes MGM. Envelhecimento e vulnerabilidade individual: um panorama de idosos atendidos pela estratégia de saúde da família. Texto Contexto Enferm. 2017; 26(2): e2700015
https://doi.org/10.1590/0104-07072017002700015
|
| [11] |
Wong WL, Su X, Li X, et al. Global prevalence of age-related macular degeneration and disease burden projection for 2020 and 2040: a systematic review and meta-analysis. Lancet Global Health. 2014; 2(2): e106–e116.
https://doi.org10.1016/S2214-109X(13)70145-1
|
| [12] |
Pelletier AL, Rojas-Roldan L, Coffin J. Vision Loss in Older Adults. Am Fam Physician. 2016; 94(3): 219–226. PMID: 27479624.
|
| [13] |
Thetford C, Bennett KM, Hodge S, Knox PC, Robinson J. Resilience and vision impairment in older people. J Aging Stud. 2015 Dec; 35: 37-48.
https://doi.org10.1016/j.jaging.2015.07.007
|
| [14] |
Cordeiro TDC, Silva LM, Monteiro EA, Pontes MLF, Casemiro FG, Rodrigues RAP. Physiological changes in vision during aging: perceptions of older adults and healthcare providers. Invest. Educ. Enferm. 2021; 39(3): e11.
https://doi.org10.17533/udea.iee.v39n3e11
|
| [15] |
Guthrie DM, Davidson JGS, Williams N, Campos J, Hunter K, Mick P, et al. Combined impairments in vision, hearing and cognition are associated with greater levels of functional and communication difficulties than cognitive impairment alone: Analysis of interRAI data for home care and long-term care recipients in Ontario. Plos One. 2018; 13(2): e0192971.
https://doi.org10.1371/journal.pone.0192971
|
| [16] |
Alves Ottaiano JÁ, Pereira de Ávila M, Caixeta Umbelino C, Chater Taleb A. As Condições de Saúde Ocular no Brasil 2019 Edição 1 – 2019. Conselho Brasileiro de Oftalmologia.
https://www.cbo.com.br/novo/publicacoes/condicoes_saude_ocular_brasil2019.pdf
|
| [17] |
Romani FA. Prevalência de transtornos oculares na população de idosos residentes na cidade de Veranópolis, RS, Brasil. Arq Bras Oftalmol. 2005; 68(5): 649-55.
https://doi.org/10.1590/S0004-27492005000500015
|
| [18] |
Alves, M. R., Nishi, M., Carvalho, K. M. de, Ventura, L. M. V. de O., Schellini, S. A., & José, N. K. (2014). Refração ocular: uma necessidade social. Rio de Janeiro: Cultura Médica. AMB/CFM/FENAM. Disponível em:
http://www.gediib.org.br/br/Documentos/pub/KIT-_final%20IMPRENSA.pdf
|
| [19] |
Artuch-Garde R, González-Torres MdC, de la Fuente J, Vera MM, Fernández-Cabezas M and López-García M (2017) Relationship between Resilience and Self-regulation: A Study of Spanish Youth at Risk of Social Exclusion. Front. Psychol. 8: 612.
https://doi.org10.3389/fpsyg.2017.00612
|
| [20] |
Windle G. Resilience in Later Life: Responding to Criticisms and Applying New Knowledge to the Experience of Dementia. Springer Nature Switzerland AG 2020 31 A. V. Wister, T. D. Cosco (eds.), Resilience and Aging, Risk, Systems and Decisions,
https://doi.org/10.1007/978-3-030-57089-7_3
|
| [21] |
American Psychological Association. (2020). The road to resilience. Retrieved from
https://www.apa.org/helpcenter/road-resilience
|
| [22] |
Windle, G. (2011). What is resilience? A review and concept analysis. Reviews in Clinical Gerontology, 21, 152–169.
https://doi.org10.1017/S0959259810000420
|
| [23] |
Zautra, A. J., Hall, J. S., Murray, K. E., & Resilience Solutions Groups (2008). Resilience: A new integrative approach to health and mental health research. Health Psychology Review, 2, 61– 64.
https://doi.org10.1080/17437190802298568
|
| [24] |
Lima, G. S.; Figueira, A. L. G.; Carvalho, E. C. d.; Kusumota, L.; Caldeira, S. Resilience in Older People: A Concept Analysis. Healthcare 2023, 11, 2491.
https://doi.org/10.3390/healthcare11182491
|
| [25] |
Infurna, F. J. Utilizing principles of life-span developmental psychology to study the complexities of resilience across the adult life span. Gerontologist 2021, 61, 807–818.
https://doi.org10.1093/geront/gnab086
|
| [26] |
Pesquisa nacional de saúde 2019: informações sobre domicílios, acesso e utilização dos serviços de saúde. Brasil, grandes regiões e unidades da federação / IBGE, Coordenação de Trabalho e Rendimento. - Rio de Janeiro, IBGE, 2020.
https://biblioteca.ibge.gov.br/visualizacao/livros/liv101748.pdf
|
| [27] |
Strand Steve, Cadwallader Stuart & Firth David. Module 5 - Ordinal Regression: Key Assumptions of Ordinal Regression. ReStore. National Centre for Research Methods (NCRM). University of Southampton. 2013.
https://www.restore.ac.uk/srme/aboutpage.php
|
| [28] |
Allison, P. D. Logistic Regression Using the SAS System: Theory and Application, Cary, NC: SAS Institute Inc. Second Edition. 2012.
|
| [29] |
Richard Williams (2008). "Ordinal regression models: Problems, solutions, and problems with the solutions," German Stata Users' Group Meetings 2008 03, Stata Users Group.
|
| [30] |
Richard Williams. Using the margins command to estimate and interpret adjusted predictions and marginal effects. The Stata Journal (2012) 12, Number 2, pp. 308–331.
https://doi.org/10.1177/1536867X1201200209
|
| [31] |
J. Scott Long and Jeremy Freese. 2014. Regression Models for Categorical Dependent Variables Using Stata, Third Edition. College Station, TX: Stata Press. ISBN-13: 978-1-59718-111-2.
|
| [32] |
Richard Williams. Adjusted Predictions & Marginal Effects for Multiple Outcome Models & Commands (including ologit, mlogit, oglm, & gologit2). University of Notre Dame.
https://www3.nd.edu/~rwilliam/
Last revised January 25, 2021.
|
| [33] |
Williams, R. (2006). Generalized ordered logit/partial proportional odds models for ordinal dependent variables. The Stata Journal, 6(1), 58-82.
https://doi.org/10.1177/1536867X0600600104
|
| [34] |
Jan-Jan Soon. The determinants of students' return intentions: A partial proportional odds model. Journal of Choice Modelling. Volume 3, Issue 2, 2010, Pages 89-112, ISSN 1755-5345.
https://doi.org/10.1016/S1755-5345(13)70037-X
|
| [35] |
Organização Mundial da Saúde. Relatório Mundial de envelhecimento e Saúde [Internet]. Genebra: Organização Mundial da Saúde; 2015 [acesso em 21 nov. 2023]. Disponível em:
https://sbgg.org.br/wp-content/uploads/2015/10/OMSENVELHECIMENTO-2015-port.pdf
|
| [36] |
Musich, S., Wang, S. S., Kraemer, S., Hawkins, K., & Wicker, E. (2018). Purpose in life and positive health outcomes among older adults. Population Health Management, 21(2), 139–147.
https://doi.org10.1089/pop.2017.0063
|
| [37] |
Yang-Tzu Li & Yvonne Su Yong Ow (2022) Development of resilience scale for older adults, Aging & Mental Health, 26: 1, 159-168.
https://doi.org/10.1080/13607863.2020.1861212
|
| [38] |
Musich S, Wang SS, Schaeffer JA, Kraemer S, Wicker E, Yeh CS. The association of increasing resilience with positive health outcomes among older adults. Geriatr Nurs. 2022; 44: 97–104.
https://doi.org10.1016/j.gerinurse.2022.01.007
|
| [39] |
Weitzel EC, Löbner M, Röhr S, Pabst A, Reininghaus U, Riedel-Heller SG. Prevalence of High Resilience in Old Age and Association with Perceived Threat of COVID-19-Results from a Representative Survey. Int J Environ Res Public Health. 2021 Jul 5; 18(13): 7173.
https://doi.org10.3390/ijerph18137173
|
| [40] |
Rodrigues FR, Tavares DMS. Resilience in elderly people: factors associated with sociodemographic and health conditions. Rev Bras Enferm. 2021; 74 (Suppl 2): e20200171.
http://dx.doi.org/10.1590/0034-7167-2020-0171
|
| [41] |
Hayat, S. Z., Khan, S., & Sadia, R. (2016). Resilience, wisdom, and life satisfaction in elderly living with families and in old-age homes. Pakistan Journal of Psychological Research, 31(2), 475–494.
|
| [42] |
Jahangir, K., Amir, S., & Parvaneh, K. (2017). The prediction of life satisfaction among the elderly based on resilience and happiness. Journal of Aging Psychology, 2(4), 229–236.
|
| [43] |
Jeste, D. V., Savla, G. N., Thompson, W. K., Vahia, I. V., Glorioso, D. K., Martin, A. S., … Depp, C. A. (2013). Association between older age and more successful aging: Critical role of resilience and depression. The American Journal of Psychiatry, 170(2), 188–196.
https://doi.org10.1176/appi.ajp.2012.12030386
|
| [44] |
Smith, J. L., & Hollinger-Smith, L. (2015). Savoring, resilience, and psychological well-being in older adults. Aging & Mental Health, 19(3), 192–200.
https://doi.org10.1080/13607863.2014.986647
|
| [45] |
Perna L., Mielck A., Lacruz M. E., Emeny R. T., Holle R., Breitfelder A., Ladwig K. H. Socioeconomic position, resilience, and health behaviour among elderly people. Int. J. Public Health. 2012; 57: 341–349.
https://doi.org10.1007/s00038-011-0294-0
|
| [46] |
Netuveli G., Wiggins R. D., Montgomery S. M., Hildon Z., Blane D. Mental health and resilience at older ages: Bouncing back after adversity in the British Household Panel Survey. J. Epidemiol. Community Health. 2008; 62: 987–991.
https://doi.org10.1136/jech.2007.0691387
|
| [47] |
Wells M. Resilience in Older Adults Living in Rural, Suburban, and Urban Areas. OJRNHC. 2010; 10: 45–54.
https://doi.org10.14574/ojrnhc.v10i2.55
|
| [48] |
Hardy S. E., Concato J., Gill T. M. Resilience of community-dwelling older persons. J. Am. Geriatr. Soc. 2004; 52: 257–262.
https://doi.org10.1111/j.1532-5415.2004.52065.x
|
| [49] |
Lima-Costa, M. F., Andrade, F. B., Souza Jr, P. R., Neri, A. L., Duarte, Y. A., Castro-Costa, E., & Oliveira, C. (2018). The Brazilian longitudinal study of aging (ELSI-Brazil): objectives and design. American Journal of Epidemiology, 187(7).
https://doi.org10.1093/aje/kwx387
|
| [50] |
United Nations Development Programme. (2022). Human Development Report 2021/2022: Uncertain times, unsettled lives shaping our future in a transforming world.
https://hdr.undp.org/informe-sobre-desarrollo-humano-2021-22
|
| [51] |
OECD (2021), OECD Reviews of Health Systems: Brazil 2021, OECD Reviews of Health Systems, OECD Publishing, Paris,
https://doi.org/10.1787/146d0dea-en
|
| [52] |
Veras, R. P., & Oliveira, M. (2018). Envelhecer no Brasil: a construção de um modelo de cuidado. Ciência & Saúde Coletiva, 23(6), 1929–1936.
https://doi.org/10.1590/1413-81232018236.04722018
|
Cite This Article
-
ACS Style
Olivares-Tirado, P.; Zanga, R. Resilience in Brazilian’s Older Persons with Visual Impairment: A Marginal Effects Approach. Soc. Sci. 2024, 13(6), 257-272. doi: 10.11648/j.ss.20241306.13
 Copy
|
Copy
|
 Download
-
@article{10.11648/j.ss.20241306.13,
  author = {Pedro Olivares-Tirado and Rosendo Zanga},
  title = {Resilience in Brazilian’s Older Persons with Visual Impairment: A Marginal Effects Approach
},
  journal = {Social Sciences},
  volume = {13},
  number = {6},
  pages = {257-272},
  doi = {10.11648/j.ss.20241306.13},
  url = {https://doi.org/10.11648/j.ss.20241306.13},
  eprint = {https://article.sciencepublishinggroup.com/pdf/10.11648.j.ss.20241306.13},
  abstract = {Background: Resilience is essential for healthy ageing in a society where people live longer and face increased individual adversity risks. This study investigated the association between visual impairment and resilience in Brazilians aged 60 and older. We explore personal, sociodemographic, and economic factors that influence the impact of visual impairment on the psychological and social support aspects of resilience outcomes. Resilience was operationally defined at an individual level as an outcome through self-report measures, expressing the preservation of psychological dimensions such as motivation, emotional well-being, and social support in the presence of visual impairment. Method: Data from the Brazilian National Health Survey (2019), a population-based, cross-sectional study using a Partial Proportional Odds Model and a marginal effect at the means to make the results more interpretable. Participants included 21,699 older adults with an average age of 69.5 years; 55% were women; 35% exhibited partial or permanent visual impairment, and 53% were considered resilient. Results: As the severity of visual impairment increases, the likelihood of resilience in older adults decreases for both men and women. Resilience increases with age, regardless of the severity of the disorder. Older men were more resilient than women in all categories of visual impairment. Regardless of the severity of the disorder, unscholarly participants show greater resilience. Participants who rated better health status had better resilience levels. Conclusions: This study suggests that, beyond the positive association with some sociodemographic factors, resilience is strongly related to cultural factors and self-perceived health status among older Brazilians.
},
 year = {2024}
}
Copy
|
Download
-
TY  - JOUR
T1  - Resilience in Brazilian’s Older Persons with Visual Impairment: A Marginal Effects Approach

AU  - Pedro Olivares-Tirado
AU  - Rosendo Zanga
Y1  - 2024/11/14
PY  - 2024
N1  - https://doi.org/10.11648/j.ss.20241306.13
DO  - 10.11648/j.ss.20241306.13
T2  - Social Sciences
JF  - Social Sciences
JO  - Social Sciences
SP  - 257
EP  - 272
PB  - Science Publishing Group
SN  - 2326-988X
UR  - https://doi.org/10.11648/j.ss.20241306.13
AB  - Background: Resilience is essential for healthy ageing in a society where people live longer and face increased individual adversity risks. This study investigated the association between visual impairment and resilience in Brazilians aged 60 and older. We explore personal, sociodemographic, and economic factors that influence the impact of visual impairment on the psychological and social support aspects of resilience outcomes. Resilience was operationally defined at an individual level as an outcome through self-report measures, expressing the preservation of psychological dimensions such as motivation, emotional well-being, and social support in the presence of visual impairment. Method: Data from the Brazilian National Health Survey (2019), a population-based, cross-sectional study using a Partial Proportional Odds Model and a marginal effect at the means to make the results more interpretable. Participants included 21,699 older adults with an average age of 69.5 years; 55% were women; 35% exhibited partial or permanent visual impairment, and 53% were considered resilient. Results: As the severity of visual impairment increases, the likelihood of resilience in older adults decreases for both men and women. Resilience increases with age, regardless of the severity of the disorder. Older men were more resilient than women in all categories of visual impairment. Regardless of the severity of the disorder, unscholarly participants show greater resilience. Participants who rated better health status had better resilience levels. Conclusions: This study suggests that, beyond the positive association with some sociodemographic factors, resilience is strongly related to cultural factors and self-perceived health status among older Brazilians.

VL  - 13
IS  - 6
ER  -
Copy
|
Download